Diagramming a SaaS Workflow for a Nontechnical Audience
Published October 21, 2026 · By Kate Steinmeyer · Presentations + Storytelling


A SaaS workflow diagram should show who acts, what changes, and where the result goes. For a nontechnical audience, the diagram is successful when someone can explain the process after one viewing without reading a dense legend.
Start with the buyer’s task
Write the task in one sentence before drawing: “An operations user imports a file and sees which records succeeded.” Include only the people, systems, and handoffs needed to explain that task. Product architecture may matter later, but putting every service, queue, and API on the first slide hides the business path.
Use a consistent visual language. Show people and systems in one style, actions in another, and results in a third. Number the steps if direction is not obvious. Label the output in words rather than relying on a checkmark or color change.
Show one level of detail at a time
A simple version might show user → file upload → field check → import summary. A second slide can expand the field check into mapping, validation, and rejected rows for a technical group. Both slides should describe the same process; the difference is the question each audience needs answered.
If an AI tool generates the diagram, compare every arrow with the actual product flow. It may add a plausible but nonexistent validation step. If an integration is simulated or optional, mark that boundary rather than drawing it as a guaranteed live connection.
Test the diagram without narration
Show the slide to someone unfamiliar with the product. Ask them to identify the start, end, who or what handles each step, and evidence of completion. If they need the presenter to decode a symbol, add a label or simplify the path.
Keep the diagram editable and store the source workflow beside it. A screenshot-only export makes release updates slower and invites stale process diagrams to survive in sales decks.
Draw one workflow for three audiences
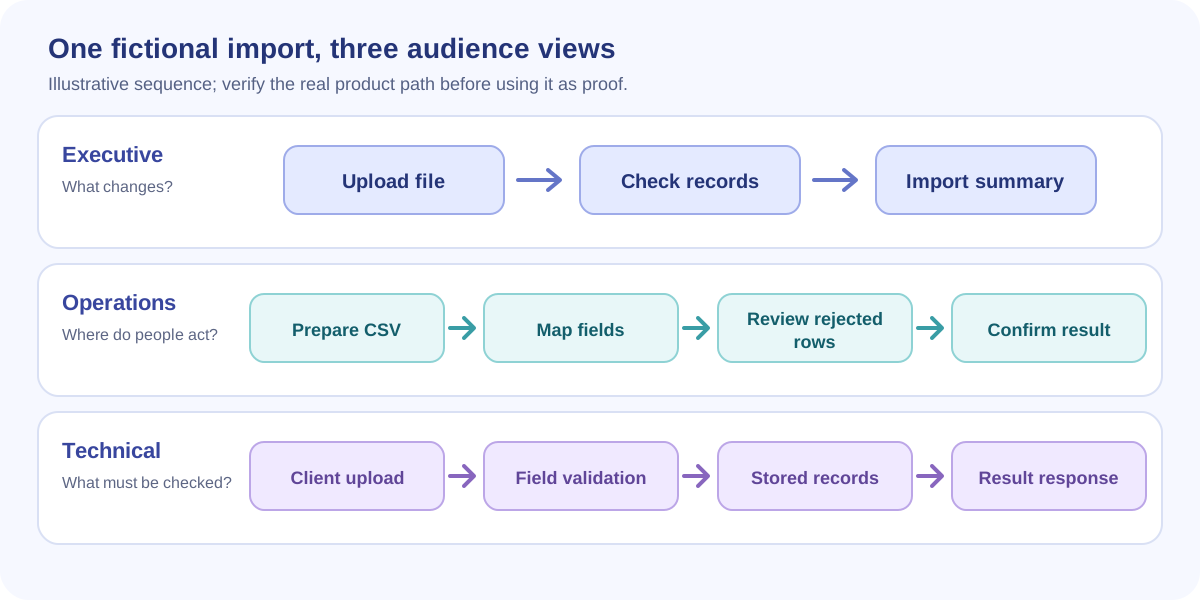
Use a fictional import workflow as the shared source: an operations user uploads a CSV, reviews a field mapping, and receives an import summary. The audience determines what the diagram emphasizes.
| Audience | Diagram shape | What to label |
|---|---|---|
| Executive | Three large stages | Outcome and source of the data |
| Operations lead | Swimlane by role | Field mapping, rejected rows, and correction path |
| Technical reviewer | System boundary diagram | Events, data movement, identity, and unverified integration points |
These are three views of the same process. If the technical diagram includes a simulated system connection, label it as illustrative. If the executive view omits the exception path for clarity, say where the full process can be reviewed. Keep the nouns consistent across all three so a buyer does not mistake an editorial difference for a product difference.